| Title Midwest Tornado Formation | |||||||||||||||||||||||||||||
|
Author Natasha Taylor American River College, Geography 350: Data Acquisition in GIS; Spring 2009 Contact Information (Address, phone, email: Optional) | |||||||||||||||||||||||||||||
|
Abstract This paper is a brief narrative of tornadoes that occur in the area of the midwestern United States known as tornado alley. The idea of this paper is to allow for the individual reader to get a feel for all things tornado. | |||||||||||||||||||||||||||||
|
Introduction This paper aimes to show tornado data in relation to tornado alley and the Lonestar state of Texas. | |||||||||||||||||||||||||||||
|
Background What is a tornado? A tornado is a rotating column of air that comes from the base of a thunderstorm’s cumulonimbus cloud that touches the ground. Referred to as a type of windstorm, a tornado has some of the same characteristics as a hurricane in that they are both considered cyclones that develop around low pressure areas in which winds spiral around the center. Tornadoes come in different forms and occur almost anywhere that conditions are favorable to their development. Tornadoes oddly enough, occur mostly in the Midwest portion of the United States and can occur year round if conditions are favorable. What causes them to form? A tornado is formed by a large-scale, low-pressure system in which warmer winds usually from the Gulf of Mexico intermingle with the cooler air from the Arctic region. This cooler air attempts to overtake the warmer air causing a thunderstorm to form. When this happens, the thunderstorm may develop an area of rotation that causes a tornado to form. These favorable conditions are found in the region the United States known as tornado alley a group of eight states comprised of Arkansas, Iowa, Texas, Kansas, Oklahoma, Nebraska, Missouri, and Illinois, each with a higher incident for tornadoes than other states in the union. Tornadoes usually begin as a funnel cloud that extends from the base of a thunderstorm. It isn’t until the funnel cloud touches the ground that it is then classified as a tornado. Once this happens it may be evident that the tornado has touched the ground due to the appearance of dust or debris in the air. Tornadoes have been known to occur in clusters known as outbreaks. They have the ability of having wind speeds ranging from 40mph to 318mph and are ranked from F0 to F5 on the Fujita scale, a scale used to classify tornadoes. Tornadoes that occur on the lower end of the scale tend to cause very little damage whereas tornadoes that are on the higher end of the scale cause more widespread damage changing the landscape and demolishing everything in its path. Tornadoes tend to occur over land but at times they tend to occur over water causing what are referred to as waterspouts. These waterspouts tend to not cause nearly as much damage as tornadoes because most destroyed structures are land based. In today’s world tornado warnings are readily available to warn people of the dangers of tornadoes. These warnings allow for people to seek adequate shelter to ride out the oncoming storm. | |||||||||||||||||||||||||||||
The State of Texas The state of Texas ranks as the number one state on a yearly basis in terms of tornadoes per year. The map to the right shows eight cities or towns that have been affected greatly by either a Fujita scale 4 or a Fujita scale 5 tornado at some point in their past. Data gathered here is gathered with help from the Geographic Names Information System which supplies us with useful help into georeferencing places in the real world A preview of the Geographic Names Information System. GNIS is available from the USGS website. |

| ||||||||||||||||||||||||||||
|
Methods The approach I took was to gather tornado data at various levels and dispaly them in different ways. Some ideas I came up with were to use various internet web sites to search for data. Other ways entailed using a home encyclopedia, and lastly just the tools available on my computer courtesy of school, ArcMap. | |||||||||||||||||||||||||||||
| On May 18, 1902 a strong F4 tornado crossed the San Antonio River. Measured at a devastating eigth of a mile wide the F4 tornado struck the tiny town of Goliad. The tornado itself took the lives of 114 persons and injured another 230. The tornado also destroyed some 150 buildings while continuing its path of destruction. To date the F4 tornado is tied with the Waco tornado of May 11, 1953 for the deadliest tornado in Texas and is also tied for 10th place within the United States. The Goliad of today has a population of 1975 and has a total land area of 1.5 miles. |

| ||||||||||||||||||||||||||||
|
Results I decided to use ArcMap as one of the ways to display my data. The way I went about this was to find cities within the state of Texas that have has some sort of tornadic activity in the past. Then I used the GNIS system provided by the United States Geological survey to georeference the points so as to be able to place them into an excel spreadsheet to then be used in an ArcMap document. From there I decided to use Google Earth to georeference them into a satellite image of one of the actual towns that had been hit by a past F4 tornado just to get a representation of how they recovered. Another problem I had encountered was when I was trying to remember how to georeference points from an excel document into ArcMap. I simply couldn't remember luckily it came to me after a while. | |||||||||||||||||||||||||||||
|
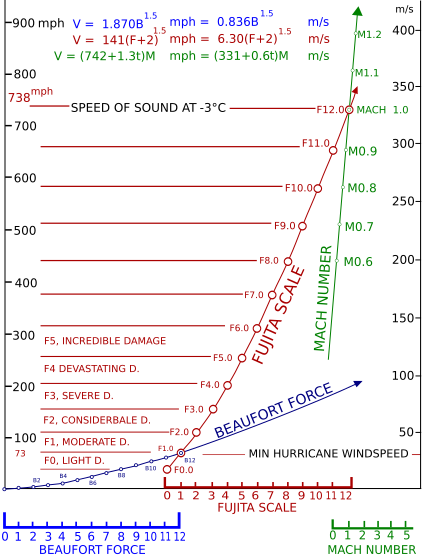
The table to the left contains the enhanced fujita code. Although taken into practice the fujita scale is still a guess at best.
The fujita scale was first introduced to the public in 1971 by Ted Fujita and Allen Pearson. The scale is used to measure wind speeds that are associated
with certain patterns of damage. So with this in mind it makes the fujita scale more of a damage scale. The origianl scale consisted of thirteen different wind
categories and was comprised of two older methods of judging wind speed, the beaufort scale and the mach number scale. The enhanced fujita scale came into light in 2007
in the United States as a means of making a beter guessed estimate of the wind speeds associated with a modern day tornado. | ||||||||||||||||||||||||||||
|
Figures and Maps | |||||||||||||||||||||||||||||
 |  | ||||||||||||||||||||||||||||
|
Analysis The choosing of what to represent was one of the hardest parts to this particular project. Also finding data on the location of tornadoes proved to be a rather interesting part of this project simply because I thought there wasn't much top be found. My favorite part was georeferencing cities with the USGS' GNIS site. A fun one I definitely would recommend exploring. A hard part was deciding which georeferencing site to use because different sites yielded different locations as to the cities displayed in the state of Texas. | |||||||||||||||||||||||||||||
|
| Conclusions I would love to see more data in terms of GIS available to the general public. I feel there needs to be more available for the general public to explore and maybe get an idea about the inner workings of a tornado.
| References Literature cited. Alphabetize by first author. Required format example: Mogul, H. Michael, 2007. The New Book Of Knowledge. Tornadoes, Vol. 18 pg. 241-242. NOAA Photo Library, NOAA Central Library; OAR/ERL/National Severe Storms Laboratory (NSSL) WWW.en.wikipedia.org/wiki/Goliad,_Texas WWW.GoogleEarth.com Ron(email) w5www@yahoo.com. (Website) http://www.qsl.net/w5www/tornado.html http://www.spc.noaa.gov/faq/tornado/ef-scale.html http://en.wikipedia.org/wiki/Fujita_scale
| Appendices Material may be included in various appendix sections at the student’s option.
| | ||||||||||||||||||||||||
